Data Analytics Tools Uncover Hidden Correlations Between Deposit Methods and Game Selection Habits
Finley Schulz · Aug 18, 2026
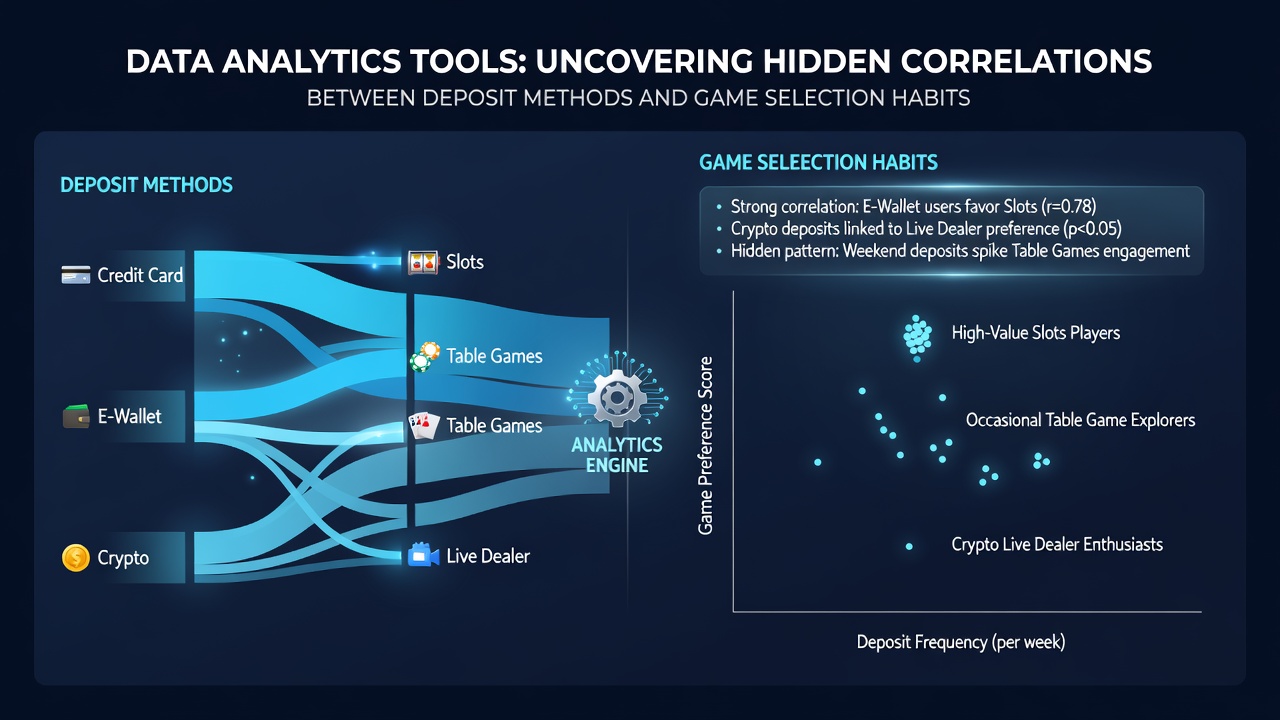
Data Analytics Tools Uncover Hidden Correlations Between Deposit Methods and Game Selection Habits
Analytics platforms now process transaction logs and gameplay records at scale, revealing patterns that link specific deposit methods to particular game categories across digital gambling environments. Operators collect timestamped data on payment types, session durations, and title selections, then apply machine learning models to identify statistically significant relationships that emerge when thousands of accounts are examined together.
Common Deposit Methods and Data Collection Practices
Players fund accounts through credit and debit cards, e-wallets, bank transfers, prepaid vouchers, and cryptocurrency options, with each method generating distinct metadata that includes processing speed, fee structures, and geographic restrictions. Platforms record these details alongside game logs, creating datasets that researchers can query for associations such as higher average bets following instant e-wallet deposits or longer session times after card-based top-ups.
Studies conducted by academic teams at institutions in Australia and Canada have examined millions of anonymized records, finding that certain payment rails align with preferences for high-volatility slots while others correspond more closely with table games that feature lower house edges. These findings rely on correlation coefficients rather than causation claims, because external factors like bonus availability can also influence choices.
Analytical Techniques Applied to Transaction and Play Data
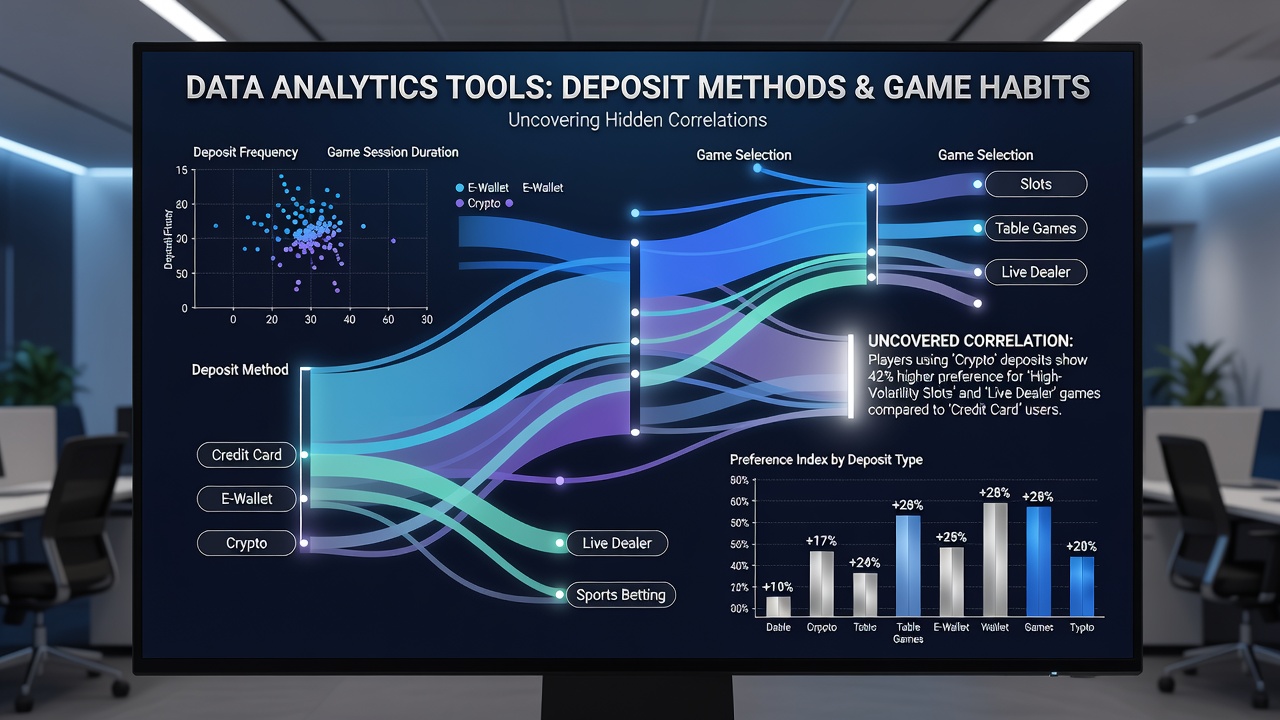
Clustering algorithms group users by deposit velocity and game category ratios, while regression models control for variables such as time of day and device type to isolate the contribution of payment method. Heat maps generated from August 2026 platform exports illustrate how mobile wallet users cluster around quick-spin slot titles, whereas wire-transfer users appear more frequently in live dealer environments that require sustained attention.
Industry reports from European regulatory bodies document similar patterns when aggregated across multiple operators, showing that prepaid methods often precede selections in progressive jackpot games where smaller, frequent deposits match the incremental betting style those titles encourage. Analysts apply survival analysis to measure how long a session lasts after each deposit type, producing Kaplan-Meier curves that highlight differences in retention curves tied to funding source.
Regional Data Patterns and Regulatory Context
Data aggregated by the Australian Gambling Research Centre indicates that players using bank transfers select video poker variants at higher rates than those using digital wallets, a pattern that persists after adjusting for age and account tenure. In parallel, Canadian provincial gaming commissions have released anonymized summaries showing cryptocurrency deposits correlate with increased activity in crash-style and multiplier games during evening hours.
These regional datasets feed into cross-border comparisons because payment regulations differ, creating natural experiments where the same game library appears under varying deposit constraints. Observers note that when instant funding options expand, the proportion of users selecting short-duration scratch-card games rises accordingly, a shift captured in time-series analyses released in mid-2026.
Practical Applications for Platform Optimization
Operators integrate these correlation outputs into recommendation engines that surface game suggestions based on a user's most recent deposit method, aiming to align content with observed behavioral clusters. A/B testing frameworks then measure whether such personalization increases average revenue per user without altering overall game return-to-player percentages.
One documented implementation at a multi-jurisdiction operator adjusted lobby layouts after internal models flagged that e-wallet depositors spent more time in high-RTP slot sections, prompting targeted promotions that highlighted those titles during checkout flows. The approach relies on continuous retraining of models as new transaction volumes arrive each month.
Limitations and Data Quality Considerations
Correlation strength varies with sample size and the granularity of game categorization, because broad labels like "slots" mask differences between classic three-reel titles and feature-heavy video slots. Self-selection bias also exists, since users who prefer certain payment rails may already differ in risk tolerance before any deposit occurs.
Researchers emphasize that external marketing campaigns and loyalty tier status can confound results, requiring multivariate controls before conclusions about deposit-game linkages are drawn. August 2026 updates to data-sharing agreements among operators in several jurisdictions have improved the ability to pool records while maintaining player anonymity standards.
Conclusion
Analytics frameworks continue to map connections between how accounts receive funds and which games receive playtime, supplying operators and regulators with empirical patterns derived from large-scale transaction and activity logs. These insights remain descriptive until further experimental designs isolate mechanisms, yet they already inform interface adjustments and compliance monitoring across multiple markets.